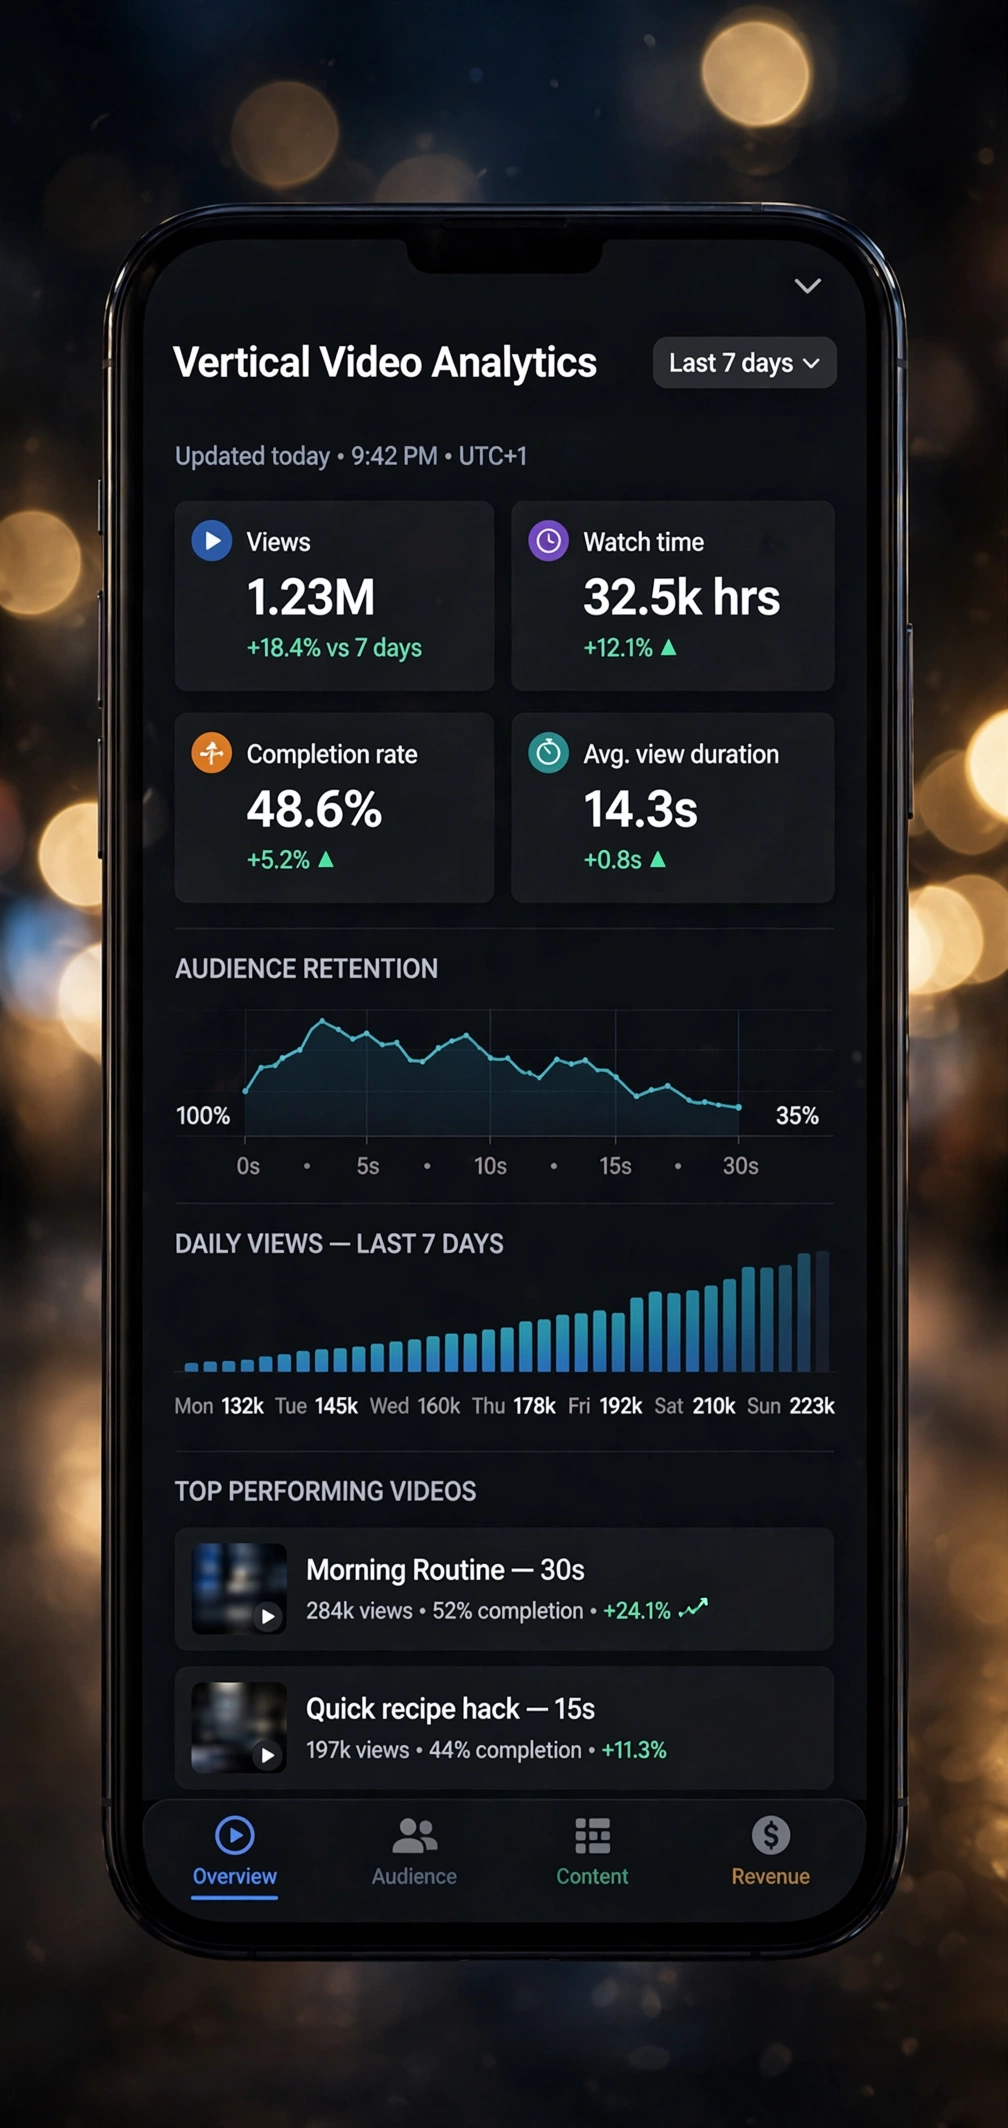


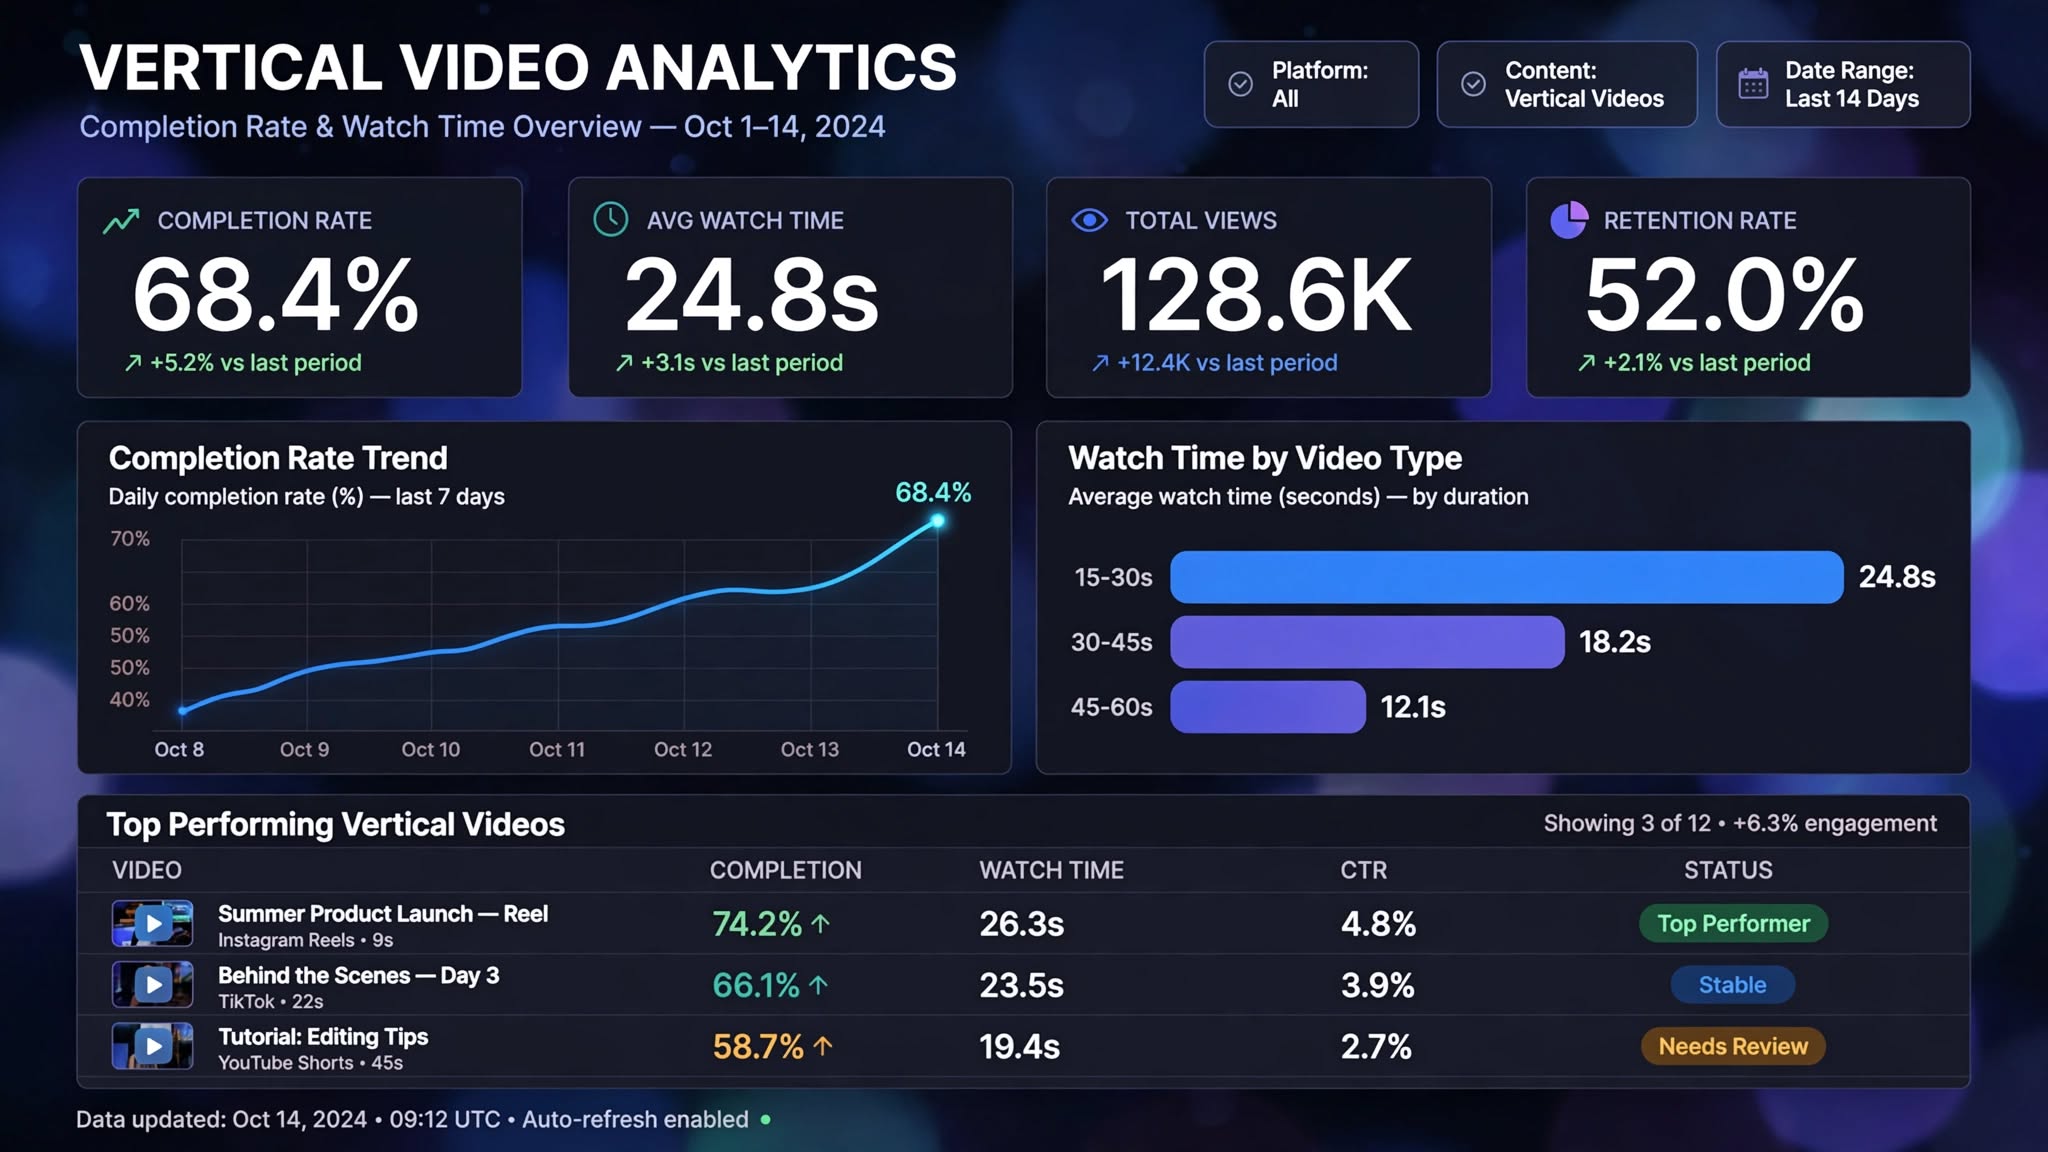
The first version of the creator dashboard had thirty-one metrics. The version creators actually use has four, a trend line, and a table of their own episodes.
The four that stayed
- Completion rate. The single number most correlated with whether an episode gets distributed further.
- Average watch time. Completion rate's denominator, and the one that explains it when it moves.
- Total views. Not useful for decisions, kept because leaving it off made everything else feel like it was hiding something.
- Retention rate. Whether the same people came back, which is the only one that compounds.
Why fourteen days
Seven is too noisy for a creator publishing three times a week — a single good episode swings the whole window. Thirty is too slow to act on; by the time a trend is visible the format has moved. Fourteen was the shortest window where the line stopped jumping.
What we took off
Impressions, reach, engagement rate, and every metric that existed because another platform shows it. Each one we removed produced one round of complaints and then silence.
A metric earns its place on the screen by changing what somebody does next. Nothing else does.
The per-episode table stayed because it is the only part creators screenshot, which is as good a usage signal as we are going to get.